Joan Analytics in MyJoan summarizes how your rooms, desks and assets are used, along with visitor numbers and air quality, and it is enabled automatically.
Room analytics is built from your synchronized room calendar data. See Security and data protection for what is stored and how to request deletion.
You will find this feature at MyJoan, in the “Analytics” section at the top of the page.
You can view four types of analytics from the left-hand menu:
- Rooms
- Air Quality
- Desks & Assets
- Visitors
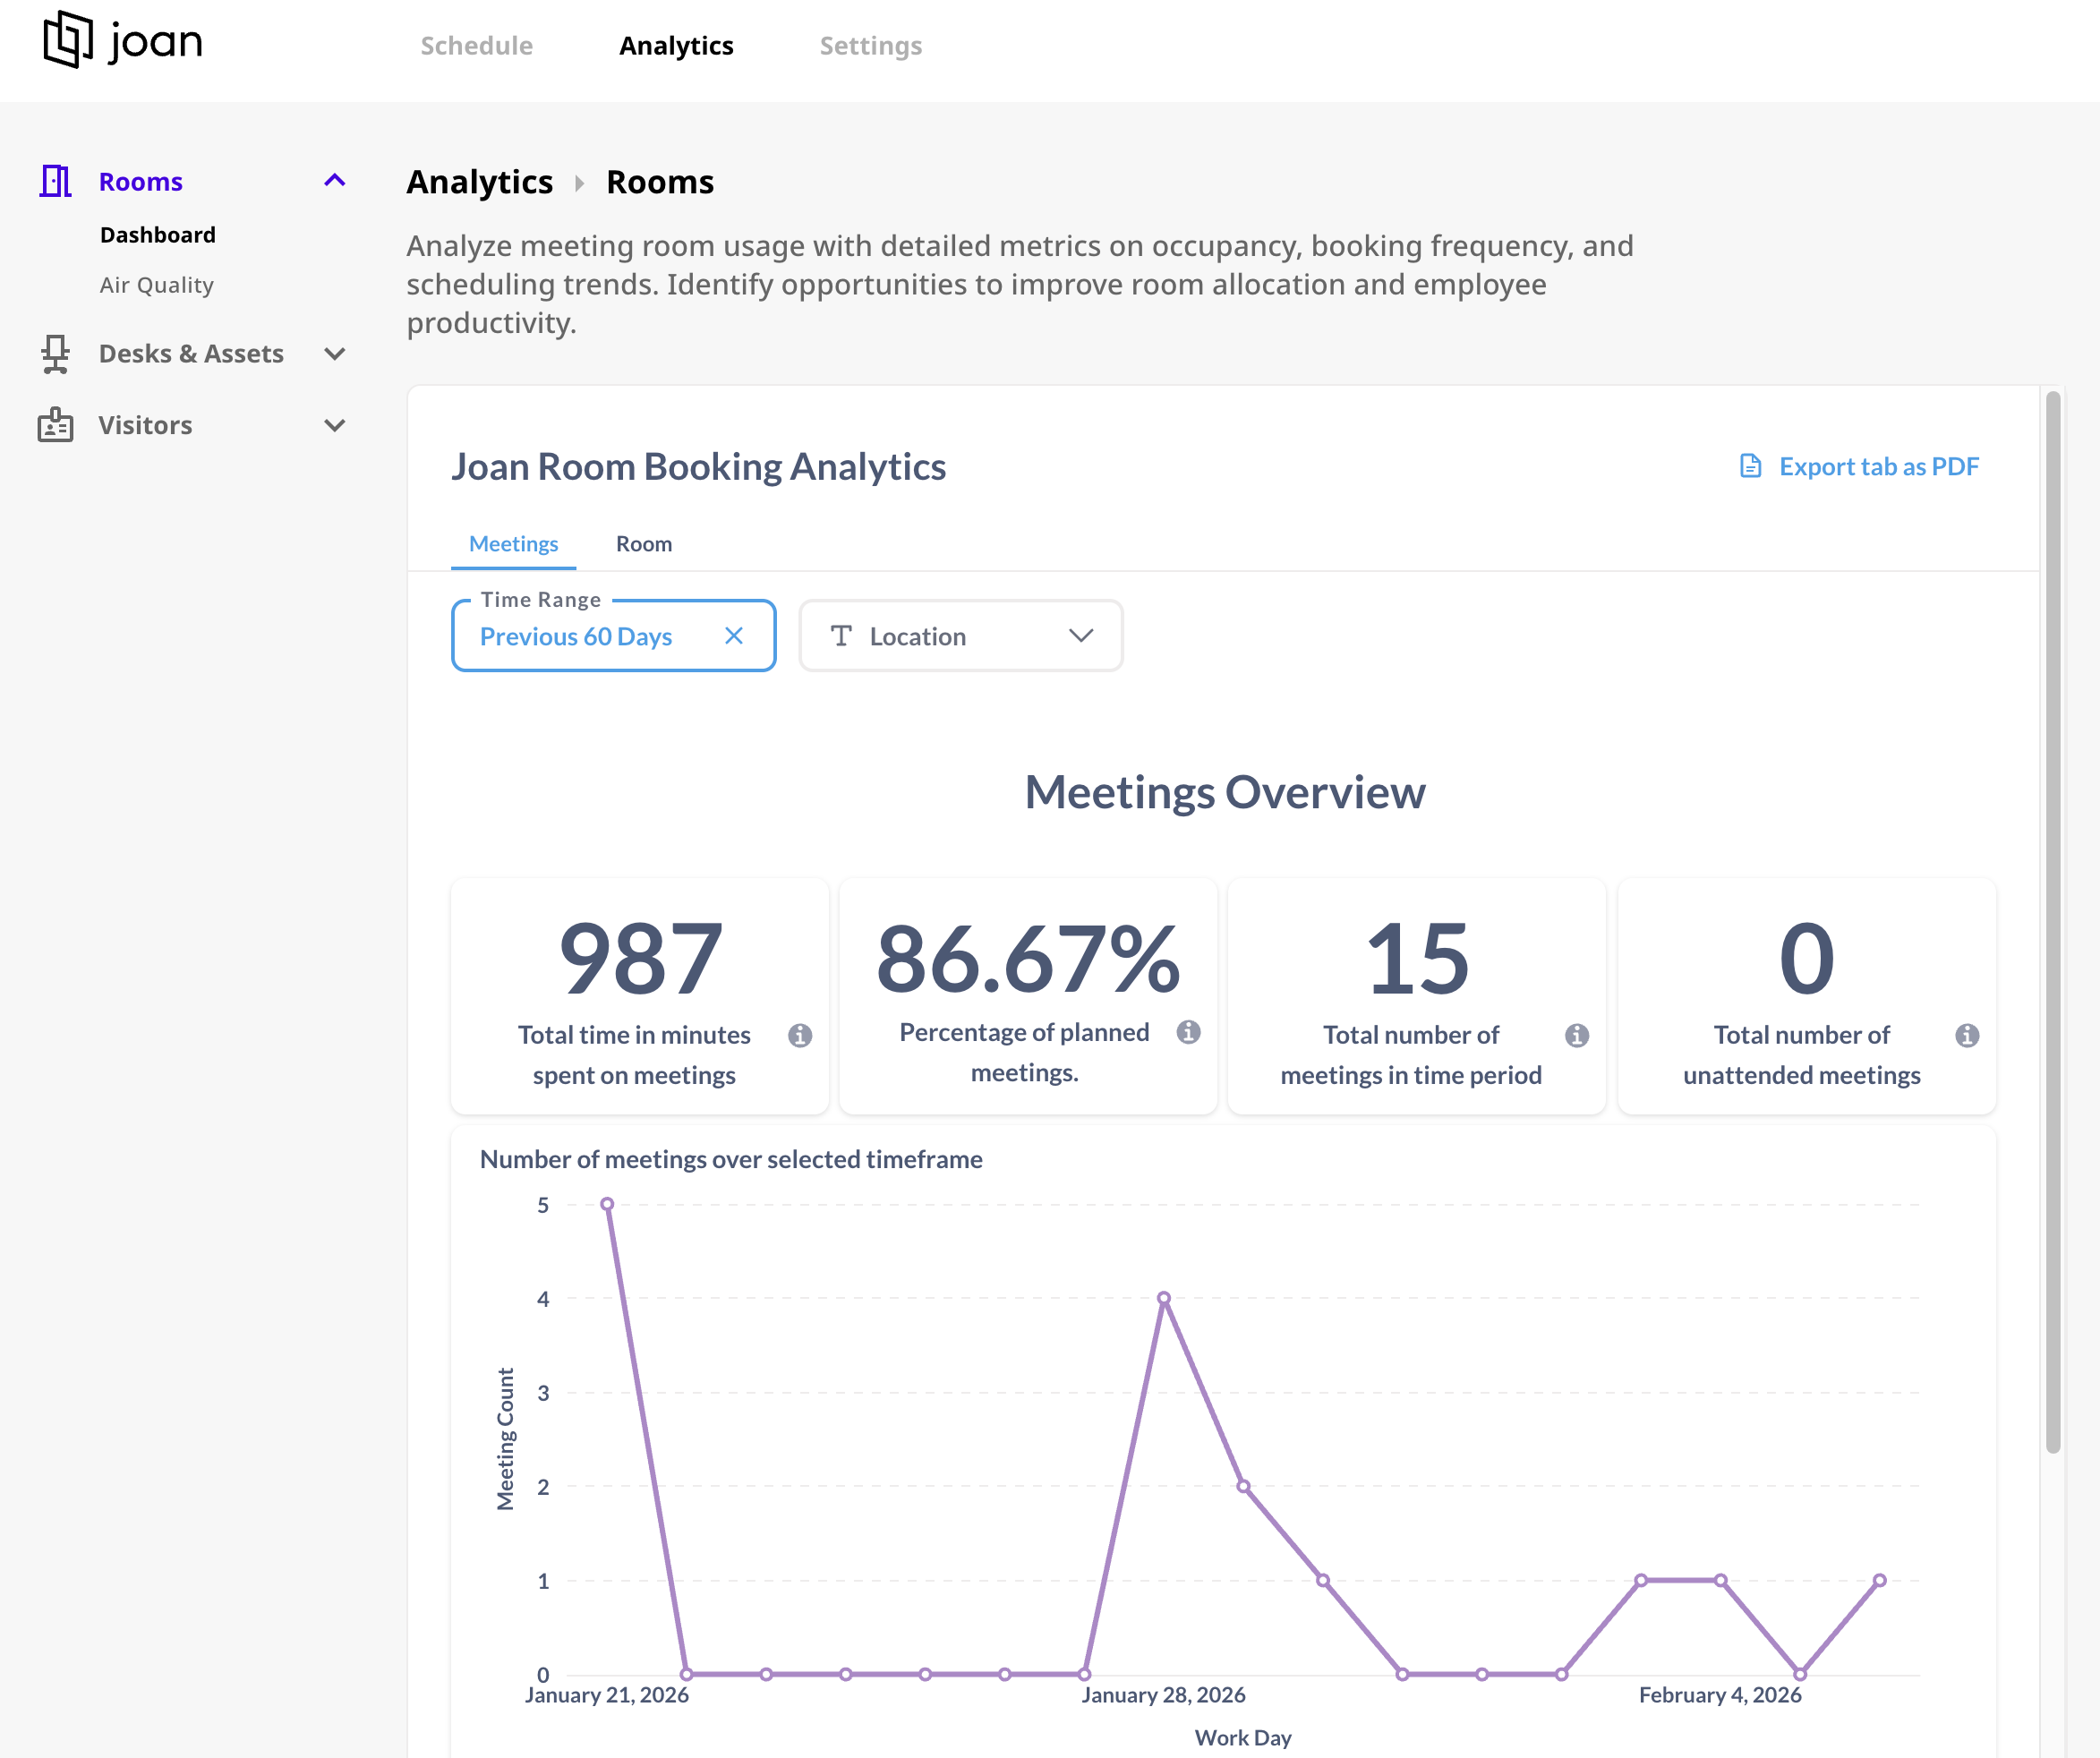
The Rooms analytics provides information:
- % of rooms occupied on a given day
- % of rooms occupied per day of the week
- % of rooms occupied per location
- Total number of unattended meetings (if the check-in feature is enabled and no one shows up to a specific meeting)
- Saved minutes per room
- One-time vs recurring meeting breakdown
Joan displays already include built-in environmental sensors that collect data continuously. With Air Quality Insights in Analytics, admins can access:
- Average temperature across spaces
- Average humidity levels
- Air quality measurements over time
- Historical trend data for any period
All this is available directly in the Joan Analytics dashboard without extra equipment or setup.
You can read more about it in Air Quality Insights in Joan Analytics.
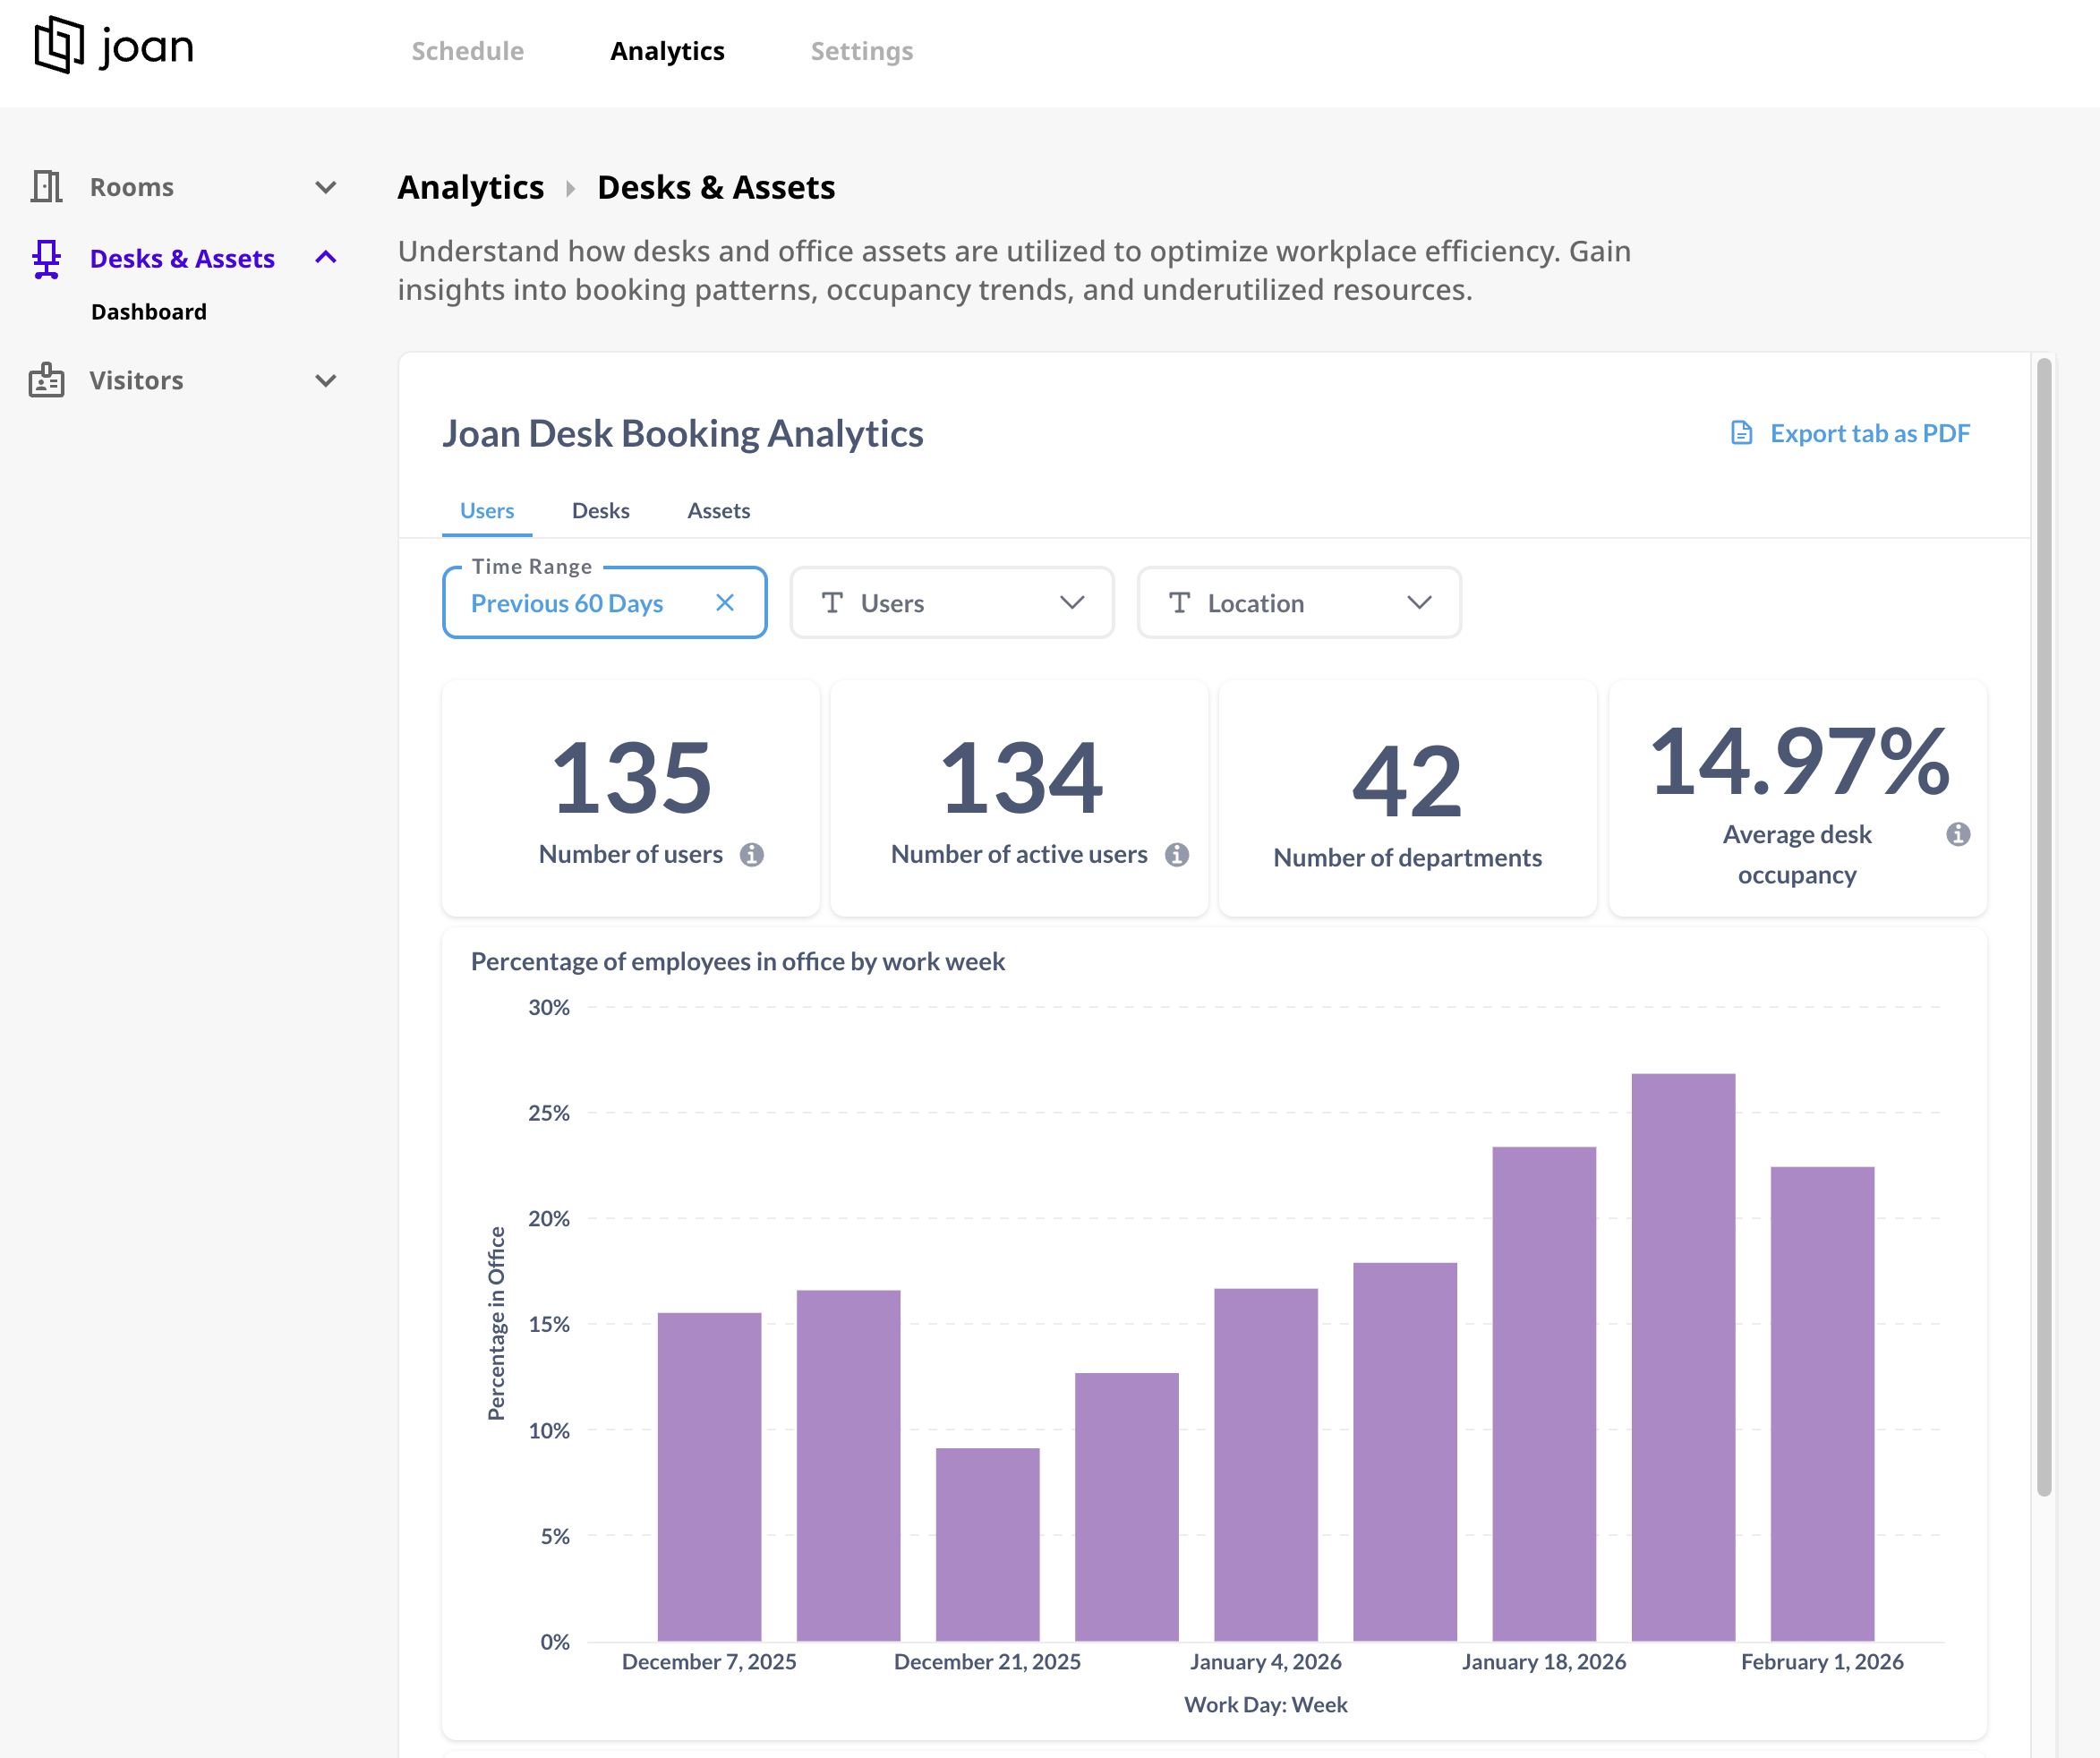
The desk analytics provides information:
- % of desks occupied on a given day
- % of desks occupied per day of the week
- % of desks occupied per location
- % days working from the office per week (number of days booked against the number of all non-weekend days)
- % days working
Information provided:
- Number of visitors
- Average number of daily visitors
- Number of Invites
- Number of Ad-Hoc visitors
- Weekly visitor count
- Visits by host
- Visitor frequency
For all the above mentioned analytics you can:
- filter data per location
- filter data by timeframe
- download the data in the reports for future analysis
*If you encounter any issues, please contact support@getjoan.com.