Companies that work in a hybrid environment require data regarding the process. The need to understand how many desks are being used, what trends they can observe, and how the policies they put in place impact the process. MyJoan offers an analytics dashboard for the Joan desk booking app to answer all these questions.
The dashboard is available in the MyJoan portal, under Analytics > Desks & Assets.[](mailto:support@getjoan.com)
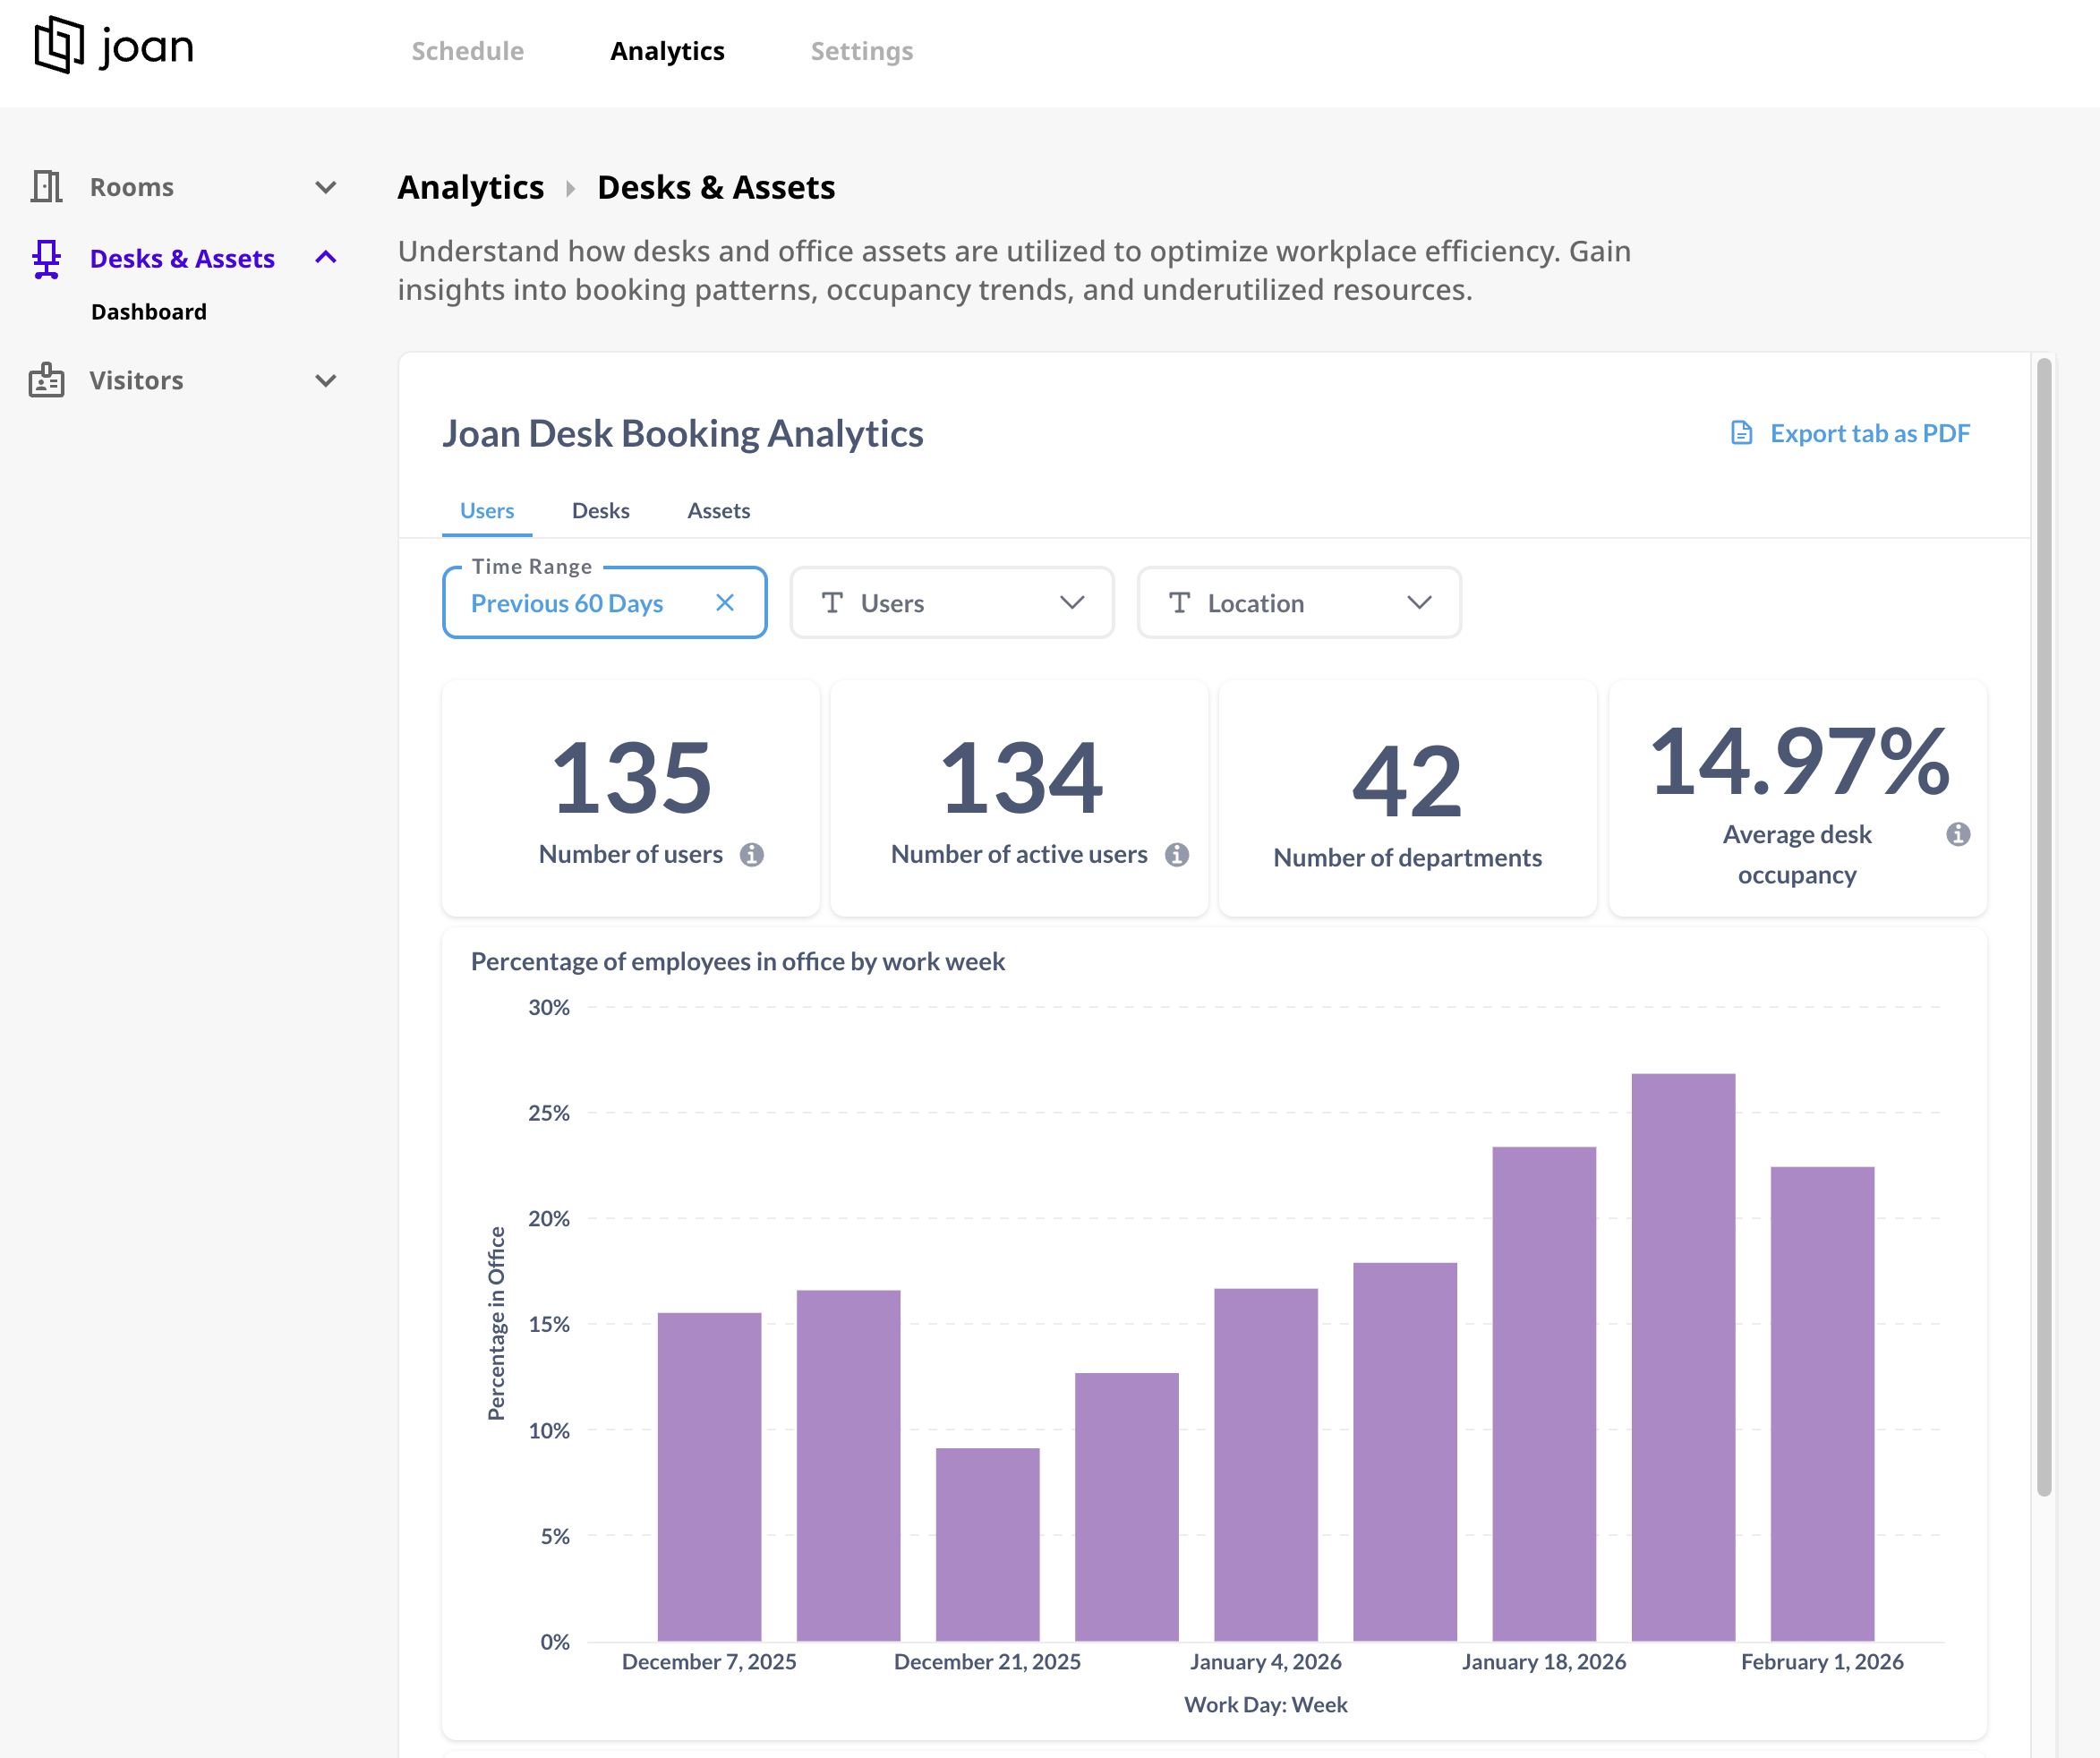
The desk analytics provides information:
- % of desks occupied on a given day
- % of desks occupied per day of the week
- % of desks occupied per location
- % days working from the office per week (number of days booked against the number of all non-weekend days)
- % days working
You can:
- filter data per location
- filter data by timeframe
- download the data in the reports for future analysis
For more information please reach out to support@getjoan.com.